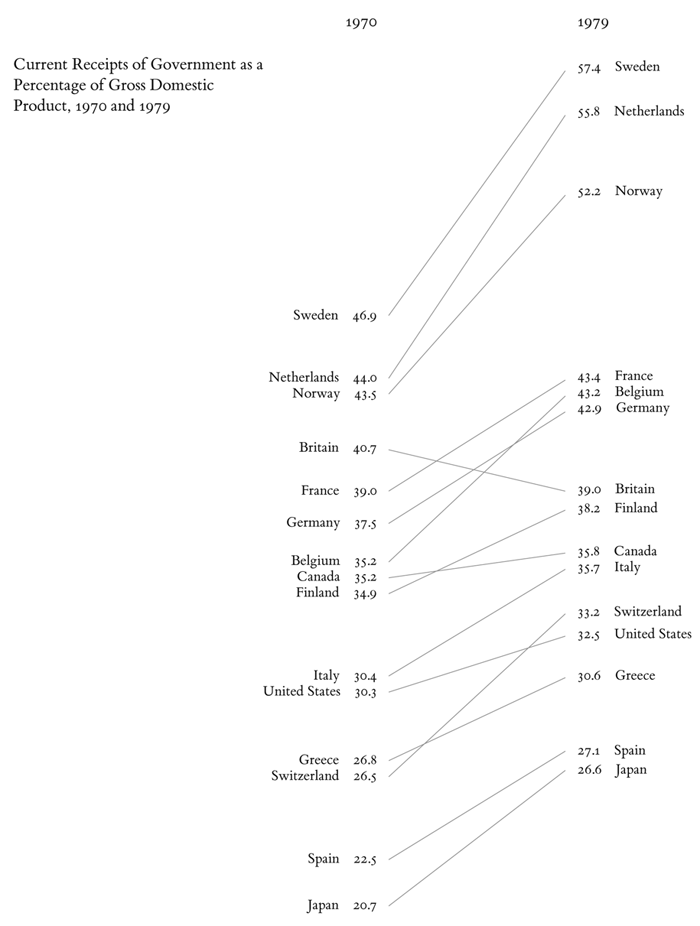
Slope Graph example
Charlie Park wrote an essay explaining
Edward Tufte's
Slope Graph idea. However, as he says, Canvas is not great for doing subtle hairlines.
Interested in the idea, I hacked this up using the lovely Raphaël library
that generates SVG.
The code is on GitHub as slopegraph
Kevin Marks, July 13th 2011
A generated example, based on Tufte's data
Current Receipts of Government as a Percentage of Gross Domestic Product, 1970 and 1979
| country | 1970 | 1979 |
| Sweden | 46.9 | 57.4 |
| Netherlands | 44.0 | 55.8 |
| Norway | 43.5 | 52.2 |
| Britain | 40.7 | 39.0 |
| France | 39.0 | 43.4 |
| Germany | 37.5 | 42.9 |
| Belgium | 35.2 | 43.2 |
| Canada | 35.2 | 35.8 |
| Finland | 34.9 | 38.2 |
| Italy | 30.4 | 35.7 |
| United States | 30.3 | 32.5 |
| Greece | 26.8 | 30.6 |
| Switzerland | 26.5 | 33.2 |
| Spain | 22.5 | 27.1 |
| Japan | 20.7 | 26.6 |
Tufte's original image from print, for comparison

